At Doximity, we work every day on solving natural language processing (NLP), recommendation, and classification modeling problems. As our data team has become more proficient with using machine learning (ML) as a solution, we’ve created a recommended process to manage risk, enable cross-team learning, and encourage best practices.
Our framework is grounded in Agile software development principles. In a previous article, we outlined how Agile inspired the structure of our modeling processes. Here, we delve into a detailed exploration of the proposed modeling lifecycle.
Our process is iterative and centers around the concept of a “report.” This document outlines the lessons from the current iteration and suggests a possible next one. The data scientist generates the report and reviews it with the various stakeholders. At this point, stakeholders can determine whether to invest in the next iteration. The following figure roughly describes the process:
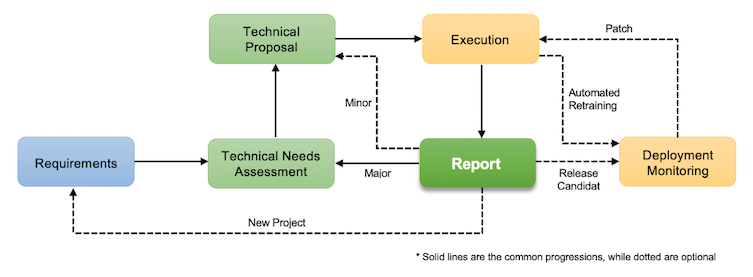
The blue stage designates the product task, the green indicates documentation, and the yellow identifies technical tasks. The cyclical relation of the green and yellow stages demonstrates the process’s iterative nature.
Let's now examine the lifecycle stages one by one.
6 Stages of an Agile Machine Learning Framework
- Requirements.
- Technical needs assessment and expected lift analysis.
- Technical proposal.
- Experiment execution.
- Report.
- Deployment and monitoring (optional).
Stage 1: Requirements
First, we have the Requirements stage. At this step, the product team, along with business leaders and other sales and marketing stakeholders, consider the potential benefits of a modeling project. For example, an e-commerce business team might believe that personalized ads can improve purchases. Business hypotheses such as this direct the R&D team on the type of model (recommender) to build and the KPI(s) to monitor (purchases). This stage captures critical information for key product needs assessment and proposal documents, providing the context for subsequent experimentation.
Although this stage generally only applies to new projects, we strongly recommend returning to it whenever teams introduce new market insights or business requirements. The main reason for such a loop is to recognize the importance of the business context within which all subsequent technical and data decisions are made.
Placing too little emphasis on the business context risks producing ill-fitted models, or even well-fitted ones that don’t deliver business needs.
Stage 2: Technical Needs Assessment
The second stage is the Technical Needs Assessment. This differs from the previous stage as the data scientist driving the project typically writes it. We can think of this stage as a response to the business requirements that the product team delivered in the first stage. As such, it should first confirm the business problem it must solve, including key stakeholders and success metrics. Due to the relatively heavy investment needed for ML projects, both in terms of time and resources, this is also the stage where we reconfirm the model’s necessity. This includes discussing whether a modeling solution is suitable for this problem and evaluating alternative solutions like rule-based systems, deterministic models, heuristics models, statistical methods, or simulations. We suggest returning to this stage whenever you’re considering a new algorithmic iteration.
Expected Lift Analysis
Beyond a direct technical argument, we also recommend a quick-and-dirty calculation of the expected KPI improvements from the ML project. We refer to this step as the lift analysis. In our experience, this expected lift study helps a great deal in managing expectations with stakeholders. To conduct this analysis, we imagine three models: one perfect, one random, and one that performs just as well as the status quo. The perfect model predicts (or classifies) the data behavior completely accurately, meaning it perfectly determines whether or not a customer will purchase a given product. The random model, in contrast, makes a random guess. Finally, the status-quo model simply replicates the current performance.
Through the hypothetical perfect and random models, we can project the upper and lower bounds of the KPI. This is the boundary of the project: We cannot outperform the perfect model, nor can we regress to worse than the random one. The difference between the status quo and the perfect KPI would be our potential lift, while the distance to random would be our risk. If the status quo is already pretty close to the perfect model in terms of the resulting KPI, justifying an ML project could be difficult, meaning perhaps greater benefits can be found elsewhere.
Stage 3: Technical Proposal
Once the R&D team has defined the requirements and reached alignment with stakeholders, the next stage is the Technical Proposal. Here, the data scientist plans the experiment. This proposal tends to address the common decisions a data scientist will encounter during a project, including what data sets are available, which algorithms to use, feature engineering, and how to model the target variables (e.g. data labels). The technical proposal also clearly lists the primary, secondary, and guardrail metrics. For example, for personalized ads, the primary KPI may be the number of purchases, the secondary KPI may be the ads’ click-through rate (CTR), and the guardrail metric may be the customer churn rate.
Beyond these modeling decisions, you should also highlight infrastructural requirements for training and deployment. Such requirements might take the form of single- or multi-core central processing units (CPUs) for computationally intensive tasks, graphics processing units (GPUs) for parallel computations and deep learning, tensor processing units (TPUs) for neural networks, sufficient random access memory (RAM), especially when working with big data storage, and high-speed network connections for distributed tasks and cloud services by platforms like AWS, Azure, or Google Cloud, to provide scalable memory and compute resources. Finally, we recommend clearly communicating foreseeable risks and rewards with stakeholders at this stage as well.
Stage 4: Experiment Execution
Now we’re ready to implement the solution, i.e., Experiment Execution. The details of this stage vary by project. Nevertheless, we can expect the initial setup and any algorithmic changes to take more time, while feature and data iterations are faster to execute. To learn about various iteration types, see our previous article.
Correspondingly, additional engineering investments, such as a framework for managing features or models, can help reduce time in future experiments. Such reusable components, however, should be scoped as independent engineering projects, separate from the modeling lifecycle itself, as they are tangential to the modeling process.
The data scientist often faces the temptation to try another solution (whether a data set, feature, or algorithm) when the results are unsatisfactory during this stage. This temptation is often the source of scope creep in modeling projects. Instead, we suggest sticking to whatever the technical proposal described and considering how to best explain why the results are below expectations. A negative result can still be a valuable learning opportunity.
An abandoned project is not a failure. It is simply a project we’ve learned is not (or is no longer) worth the investment.
Stage 5: Report
Regardless of the performance during the experiment, the Report stage is the main deliverable of the iteration. This report is the artifact of the data experiment, so the data scientist should document what they did and how, especially against the status quo. Most importantly, the data scientist should attempt to interpret the results, building from the initial hypothesis to make conjectures about the data space explored in the experiment.
To borrow the earlier e-commerce example, if an algorithm and feature set did not perform as expected, we can conjecture (with results as support) that perhaps different age groups do not have different purchasing patterns as we initially anticipated. This is not an easy exercise, but it’s also where the data scientist shines. The report allows product and business teams to make further decisions, perhaps even in unexpected areas. Other potential recommendations may include performing another iteration without a deployment.
Stage 6: Deployment and Monitoring (Optional)
The final, optional stage is Deployment and Monitoring. During this stage, the model and implementation code are processed according to the team’s release procedures, potentially including quality assurance, split-testing, phased rollout, and/or simulation. If necessary, tasks to set up monitors and track performance may also be included in this stage. If there happens to be a regression after the launch, you should consider a revert, with a return to the report stage for deeper analysis.
Going back to the e-commerce example, at this stage we can do a A/B test between regular and personalized ads and see where the resultant KPIs stand in relation to the expected lift analysis done in stage two. If the results are good, we can roll out the new ad recommendation model to 10 percent, 25 percent, 50 percent and then 100 percent of the users and set up dashboards to monitor KPIs on an ongoing basis.
A model may iterate multiple times with different findings (reports) without ever being deployed. Hence, we define a “failed project” as “one from which we learned nothing.”
Each modeling project is formulated within our knowledge of the market, including customer behaviors, technical limitations, and external factors, upon which we make business and product decisions. As such, our modeling iterations are ultimately data experiments to better learn about that space.
This reorientation accepts that a model may iterate multiple times with different findings (reports) without ever being deployed. It also defines a “failed project” as “one from which we learned nothing.” As the scope is constrained to a single experiment, business stakeholders can intervene if they no longer feel that the benefit is worth additional (time) investment or simply that the requirements have pivoted away from the problem being solved. We believe the lessons should be considered as business insights, as relevant as other analytic deliverables.
Agile Makes Iterative Learning Smoother
In conclusion, the Agile-inspired framework covered in these articles highlights the dynamic modeling process at Doximity and also offers a guide for tackling complex data science projects using ML solutions. Through the stages of requirements, technical needs assessment, technical proposal, experiment execution, and (optional) deployment and monitoring, each cycle becomes an opportunity to report continuous learning, risk management, and collaboration. Thus, iterative learning helps teams adapt to changing business landscapes and emerging data trends, fostering innovation and informed decision-making.