Today, financial reporting is no longer just a matter of presenting a list of numbers for a business owner to scroll through. As businesses grow and expand, effective financial reporting becomes a crucial element of decision-making. Scorecards and graphics are two powerful tools that can help improve financial reporting and provide a clearer picture of a company’s financial health.
What’s the Problem With Financial Reports?
In fact, I’m an accountant and still find pages and pages on numbers typically presented in financial statements hard to follow, complicated, and also too historical to really guide good decision-making going forward.
Although financial reports are an essential tool for businesses to keep track of their performances, they do have their weaknesses. One of the biggest drawbacks of financial reports is that they’re historical in nature. They reflect past performance and don’t necessarily provide insights into future performance. Additionally, financial reports can be complex and difficult to understand, especially for those without a background in finance. This can lead to misinterpretations of data and poor judgment.
Finally, financial reports often focus solely on financial metrics, neglecting non-financial factors that can impact a company's overall success. For example, most businesses are impacted by factors like employee retention, economic changes and technological disruption. Most of these are not accurately reflected in the financials.
Replace Financial Reports With Scorecards
Instead, breaking the business down into areas and creating scorecards or visual representations of key performance indicators (KPIs) that enable decision-makers to quickly and easily assess the financial performance of each. These scorecards allow owners to benchmark the business against itself at key moments in time. They’re also helpful to owners and CEOs to communicate the state of the business to employees and external parties. By focusing on a consistent set of critical success metrics and having them all in one place, decision-makers can easily identify areas of improvement or potential problems.
While scorecards assign letter grades, graphics offer visual representations of data that can help to illustrate trends and patterns that may not be immediately apparent in a list of numbers. You can use them to compare data, track changes over time, and highlight key insights.
When it comes to determining the value of a business, it’s important to have a clear understanding of all the factors that contribute to its overall worth. There are six core areas that you should typically focus on in this regard:
6 Factors That Determine Business Valuation
1. High-level business insights: This includes an understanding of the business model, market potential, customer base, and competitive landscape.
2. Financial metrics: This includes revenue, profit margins, cash flow, and balance sheet metrics.
3. Non-financial metrics: This includes customer satisfaction, employee engagement, product quality, and brand reputation.
4. Credit: This includes the business’s credit score, debt-to-equity ratio, and other factors that impact its ability to secure financing.
5. Exit readiness: This includes the business’s readiness for an exit, such as a sale or IPO.
6. ESG: This includes the business’s environmental, social, and governance practices.
In addition to these core areas, compare the business to other, similar businesses in the industry to get a sense of its relative value and performance. By focusing on these areas, you can get a comprehensive snapshot of the business's value and can make informed decisions about its future.
Why Scorecards Work Better
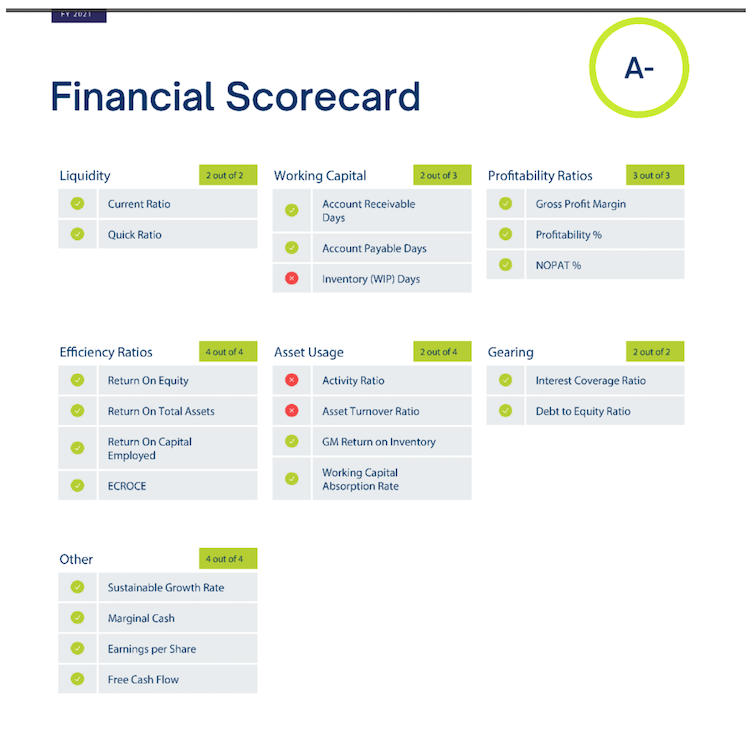
As an accountant, my primary emphasis lies in delving into financial analysis. Yet, this analysis is not the ultimate determinant of value. The profit (or return) is only half of the valuation equation. The other half is risk and this is typically made up of non-financial metrics. Understanding the business’s overall performance is crucial, and employing a financial analysis tool for this purpose provides business owners with a snapshot of financial performance, pinpointing areas for enhancement. The diagram below offers a typical overview, assessing profitability, cash flow, debt levels, and efficiency, and using a traffic light system to signal performance — green for good, amber for caution, and red for areas requiring attention.
The tool zeroes in on measurements pertinent to your business. In the given example, 19 out of 22 measures favored the business, spotlighting three unfavorable aspects — Inventory (WIP) Days, Activity Ratio, and Asset Turnover Ratio. With an A- score, this small- to medium-sized business is doing quite well. Understanding key financial drivers and performance indicators at any business stage is vital for stepping in and effecting improvements.
How to Use a Scorecard System
Here are some ways you can use scorecards and graphics to improve financial reporting.
1. Identify trends and patterns in financial data
You can track revenue growth with a scorecard, while a graph can show the percentage change in revenue over time. You can use this information to identify potential issues or opportunities for improvement.
2. Simplify complex data
Financial data can be complex and difficult to understand. By presenting data in a visual format, scorecards and graphics can help to simplify complex data and make it easier to understand. This can be particularly useful when presenting financial data to non-financial stakeholders.
3. Highlight key insights
Scorecards and graphics can highlight key insights and trends that may not be immediately apparent in a list of numbers. For example, a graph may show that sales are increasing, but the growth rate is slowing. This information can identify areas for improvement or potential issues.
4. Provide context
Scorecards and graphics can provide context for financial data. For example, a scorecard may include industry benchmarks, which can help to provide context for a company’s financial performance. This information can identify areas where a company is outperforming or underperforming compared to competitors.
5. Enable data-driven decision-making
Scorecards and graphics can give decision-makers the information they need to make data-driven decisions. By having key metrics in one place, decision-makers can quickly and easily assess a company’s financial health and identify improvement areas.
Scorecards Improve Your Reporting Systems
Scorecards and graphics are powerful tools that can help to improve financial reporting. By visualizing financial data, they can simplify complex information, highlight key insights, and enable data-driven decision-making. By incorporating scorecards and graphics into their financial reporting, businesses can better understand their financial health and make more informed decisions.