Data cleaning and preparation is an integral part of data science. Oftentimes, raw data comes in a form that isn’t ready for analysis or modeling due to structural characteristics or even the quality of the data. For example, consumer data may contain values that don’t make sense, like numbers where names should be or words where numbers should be. Finally, raw data may contain missing or unknown values, which makes analysis difficult.
One of the first steps of assessing data cleanliness is quality analysis, which involves tasks such as counting the number of missing values in each column and detecting outlier values in the data. An outlier value is simply an extreme value that deviates significantly from most of the others in the data. For example, if you have a data set containing salaries of people in a given neighborhood that mostly fall around $70,000, a $1 million salary would be an example of an outlier.
Once we’ve checked data quality, we need to resolve any missing, outlier or bad values in the data. Consider consumer data with a column containing integer values for ages. A string in this column would be an example of a bad value because you can’t directly perform calculations, like taking the average or standard deviation, with strings. So, we need a way to either convert the bad value into a number or remove the value altogether.
Handling missing values is another key part of data cleaning. There are many ways to handle missing values in data, only a few of which we will discuss here. The most basic way is to simply remove them, but this isn’t always ideal since it can result in a significant loss of data. Another common method, data imputation, involves replacing the missing values with a statistic. For numbers, we can replace missing values with a statistic like the mean or median. In the case of categorical values, which are often strings, we can replace them with the mode.
The Python library Pandas is a statistical analysis library that enables data scientists to perform many of these data cleaning and preparation tasks. Data scientists can quickly and easily check data quality using a basic Pandas method called info that allows the display of the number of non-missing values in your data. Pandas methods like dropna() allow you to remove missing values and fillna() allows you to replace missing values. The Pandas to_numeric method allows you to force a column to have numerical values by converting non-numeric values to missing values which can later be imputed with fillna() or removed with dropna(). Finally, simple data filtering with Pandas data frames can remove outliers in data.
Here, we will be looking at how to perform data cleaning and preparation on the Boston housing data set.
Data Cleaning in Python
Data Quality Analysis
The first step of data cleaning is understanding the quality of your data. For our purposes, this simply means analyzing the missing and outlier values. Let’s start by importing the Pandas library and reading our data into a Pandas data frame:
import pandas as pd

df = pd.read_csv("HousingData.csv")

print(df.head())
We see here that the data contains 14 columns:
CRIM - per capita crime rate by town
ZN - proportion of residential land zoned for lots over 25,000 square feet
INDUS - proportion of non-retail business acres per town.
CHAS - Charles River dummy variable (one if tract bounds river; zero otherwise)
NOX - nitric oxides concentration (parts per 10 million)
RM - average number of rooms per dwelling
AGE - proportion of owner-occupied units built prior to 1940
DIS - weighted distances to five Boston employment centres
RAD - index of accessibility to radial highways
TAX - full-value property-tax rate per $10,000
PTRATIO - pupil-teacher ratio by town
B - 1000(Bk - 0.63)^2 where Bk is the proportion of Black residents by town
LSTAT - percentage lower status of the population based on property value
MEDV - Median value of owner-occupied homes in $1000's
Next, let’s take a look at how many missing values are in the data. We do this with the Pandas info method:
df.info()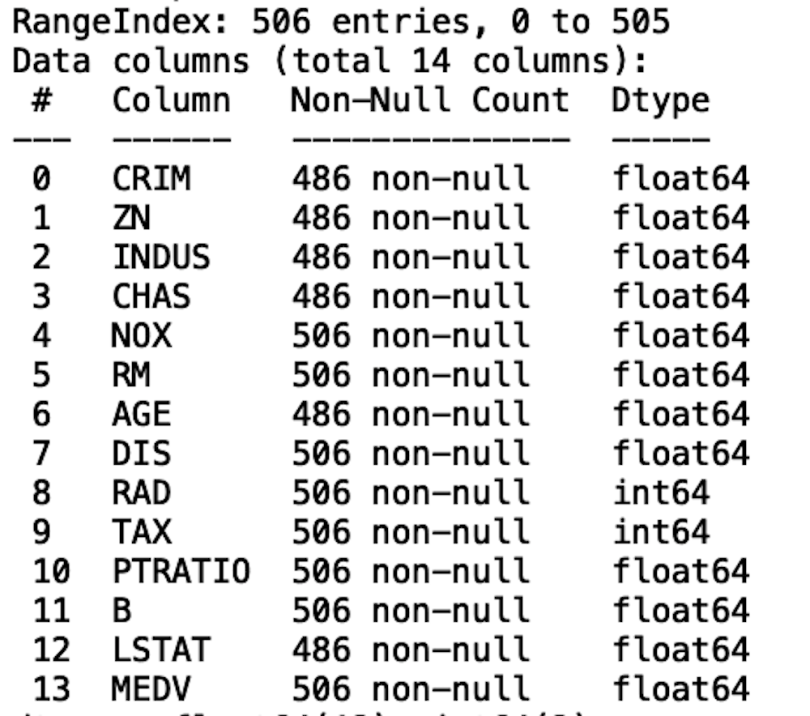
We see that, at the top of the displayed output of the info method, we have RangeIndex: 506 entries. If we look at the Non-null Count column in our displayed output, we see that the columns with 506 non-null values have zero missing, while columns with less than 506 non-null values have some missing. For example, the Crim column hass 486 non-null values, which means that it contains 20 missing values.
The next thing we can do is analyze the outliers in some of these columns by generating box plots for a column. Box plots are useful for detecting outliers because they provide a convenient way to visualize the mean, dispersion and skewness in data. To do this, let’s import the Python visualization libraries Seaborn and Matplotlib
import seaborn as sns
import matplotlib.pyplot as plt
Now, let’s look at the box plot of the average number of rooms per dwelling in Boston houses:
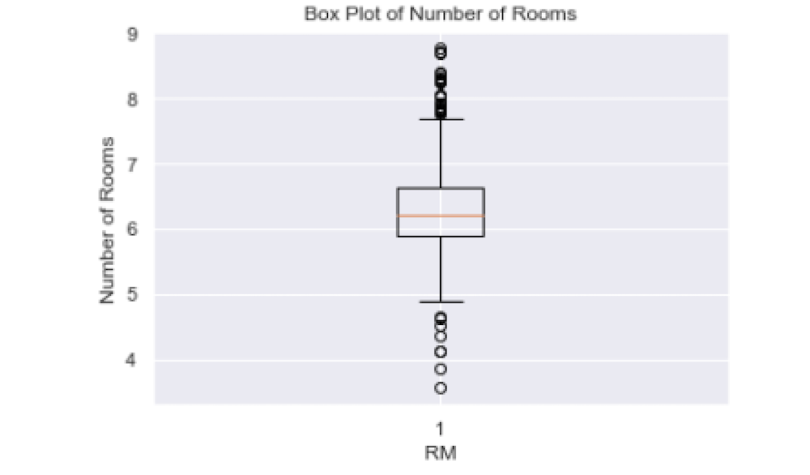
The black circles in the plot correspond to outliers and those between the bottom and top dash make up most of the values for the room number. Anything below five and above eight corresponds to outliers.
Handling Missing Values
Another important part of data cleaning is handling missing values. The simplest method is to remove all missing values using dropna:
print(“Before removing missing values:”, len(df))
df.dropna(inplace=True)
print(“After removing missing values:”, len(df))
We see that the number of records in our data frame decreases from 506 to 394. So, a better way to deal with missing values is to impute them. The simplest method would be to replace missing numeric values with a statistic like the mean because it is easy to calculate compared to more sophisticated methods. Let’s do this for the Crim column:
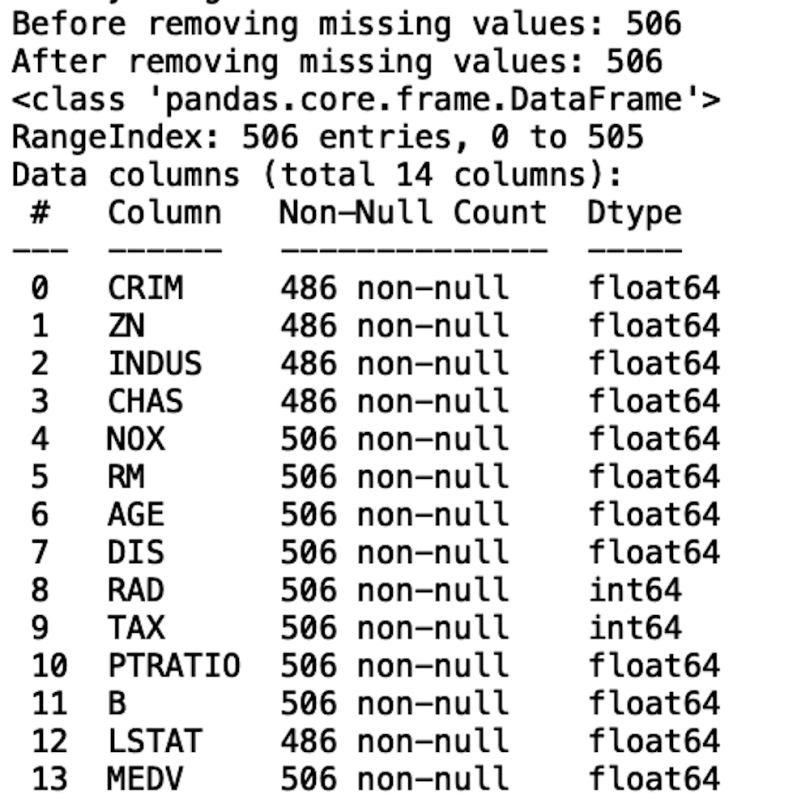
We see that the length of the data frame hasn’t changed and that the Age column no longer has missing values. Let’s repeat this process for the rest of the columns:
df['CRIM'].fillna(df['CRIM'].mean(),inplace=True)
df['ZN'].fillna(df['ZN'].mean(),inplace=True)
df['INDUS'].fillna(df['INDUS'].mean(),inplace=True)
df['CHAS'].fillna(df['CHAS'].mean(),inplace=True)
df['LSTAT'].fillna(df['LSTAT'].mean(),inplace=True)

df.info()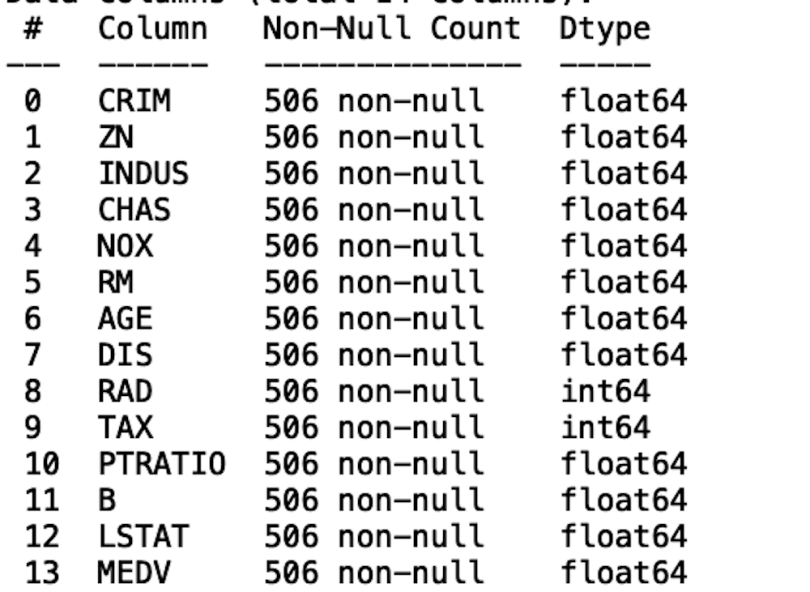
Now we see that none of the columns contain missing values.
Handling Bad Values
Another important part of data cleaning is handling bad values, which are values that either don’t make sense or that have an unexpected type. For example, the list of ages should be integers. So, for this list, a bad value for age could be a character or word or a large number that wouldn’t make sense for an age, like 500. We will consider the example of some age values being strings. This data already comes pretty clean in this aspect, so we will artificially add bad string values. Let’s reread in our data frame:
df_original = pd.read_csv("HousingData.csv")Let’s print the mean age:
print(df_bad['AGE'].mean())
Here, we will define a new data frame called df_bad, where ages over the mean will be strings. Again, this is to simulate how we deal with real, often messy, data.
df_bad['AGE'] = [str(x) if x > df_bad['AGE'].mean() else x for x in list(df_bad['AGE']) ]Now, if we try to print the mean age, we get:
print(df_bad['AGE'].mean())
This error occurs because you can’t calculate the average between strings and integers, which is a data quality issue that often arises when working with real data. We can force the bad values to be integers using a Pandas method called to_numeric:
df_bad['AGE'] = pd.to_numeric(df_bad['AGE'], errors = 'coerce')
print(df_bad['AGE'].mean())
We see that we are now able to calculate the mean age.

Handling Outliers
Another data cleaning method is removing outliers in data. Recall the box plot we generated earlier for the number of rooms:
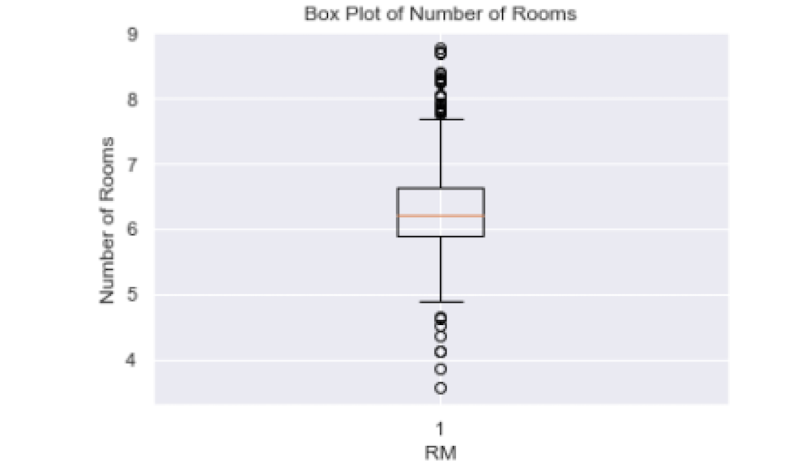
Removing outliers is important for performing statistical analysis and building predictive models since they can skew statistics and render them uninterpretable. Further, outliers can negatively affect the performance of a predictive model.
We will use the Z-score to remove outliers from a single column, where the Z-score is a measure of how far a value is from the mean. Values that are far from the mean are typically outliers. For example, a value three standard deviations from the mean may be considered an outlier. Let’s remove outliers from the Rm (number of rooms) column:
from scipy import stats
import numpy as np
print("Length before removing RM outlier:",  len(df_bad))
df_bad['RM_zscore'] = np.abs(stats.zscore(df['RM']))
df_clean1 = df_bad[df_bad['RM_zscore']< 3]
print("Length after removing RM outlier:",  len(df_clean1))
We can also do this for other numerical columns. Let’s define a function that takes a column name as input and returns a data frame where the outliers in that column are removed:
def remove_outliers(column_name, df_in):
    print(f"Length before removing {column_name} outlier:",  len(df_in))
    df_in[f'{column_name}_zscore'] = np.abs(stats.zscore(df_in[f'{column_name}']))
    df_clean = df_in[df_in[f'{column_name}_zscore']< 3]
    print(f"Length after removing {column_name} outlier:",  len(df_clean))
    return df_clean
Let’s apply this function to the Dis column (weight distances to five Boston employment centers):
df1 = remove_outliers('DIS', df_bad)
We see that in both cases removal of outlier results in the loss of data, which is to be expected.
The code from this post is available on GitHub.
Cleaning Data Is Easy
Data cleaning and preparation is an integral part of the work done by data scientists. Whether you are performing data summarization, data storytelling or building predictive models, it is best to work with clean data to obtain reliable and interpretable results. For example, when summarizing the results of statistical analysis, issues like missing values, bad values and outliers must be addressed since that may significantly impact results.
Further, if a data scientist seeks to frame an analytical problem and motivate the problem through data storytelling, the data needs to be clean. Issues such as outliers and missing values can result in a poorly defined analytical problem.
Finally, missing values, bad values and outliers can significantly impact the accuracy of predictive models. This is because the underlying algorithm for most machine learning models calculates learning weights based on the statistics in the data, which these issues can heavily skew. Having a good understanding of the basic methods for cleaning data in Python is an invaluable skill for any data scientist.


